
Economic development and growth entail large-scale structural transformation of economies. Many Asian and African economies are now undergoing such structural transformation—typically from agriculture to manufacturing and service sectors. This transformation inevitably involves reallocation of workers from the primary sector to the manufacturing and service sectors. One of the important questions arising is whether such growth led by structural transformation helps the poor. On the one hand, growth may lift people out of poverty and therefore improve living standards for everyone. On the other hand, growth may increase income inequality by benefiting the rich more than the poor.
In Viet Nam, one such developing economy, the government introduced a series of economic reforms in 1986, termed Doi Moi. These reforms enabled private lease of agricultural land (which enabled leaseholders to trade land and seek rent on land), deregulated the domestic market significantly, and introduced trade liberalization measures. Structural transformation has led to sustained economic growth in Viet Nam, but at the expense of increasing income inequality. The country’s economic growth averaged about 6% over the last 3 decades; the 2000s saw average growth rates of about 6.4%. Gross domestic product per capita at purchasing power parity (PPP) increased from $970 in 1990 to $6,023 in 2015. The proportion of the population living on under $3.10 a day (at 2011 PPP) decreased from 34.7% to 3.5%. However, in the same period, the World Bank GINI index for Viet Nam increased from 35.7 in 1992 to 38.7 in 2012. * There is also evidence that the reduction in poverty and dividends from growth were spread unevenly across the country, increasing income inequality between regions and to some extent within regions (World Bank 2013).
In our working paper, we study how structural transformation contributes to income inequality. As shown in Figure 1, there is a large shift across the income distribution from agriculture to manufacturing. This is particularly prominent in the increased participation in manufacturing for those in the 30th–65th percentile of the income distribution.
Figure 1: Sectoral participation by income quantile
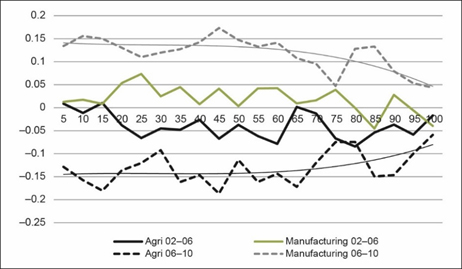
Agri = agriculture.
Source: Authors’ calculations based on Vietnam Household Living Standards Survey 2002, 2006, and 2010.
There is also evidence that the rate of change from agriculture to manufacturing varies by region, widening the income inequality between regions. Figure 2 illustrates that the gross domestic product has widened across the provinces between 2002 and 2010. From 2006 to 2010, we find that regions and provinces with traditionally high levels of agriculture—the north central coast and the central highlands—also experienced an increase in the GINI. Migration of some households within the center of the income distribution to manufacturing-intensive regions may partly explain this change as such moves widen the GINI for the remaining population in a region.
Figure 2: Per capita gross regional product (local prices)
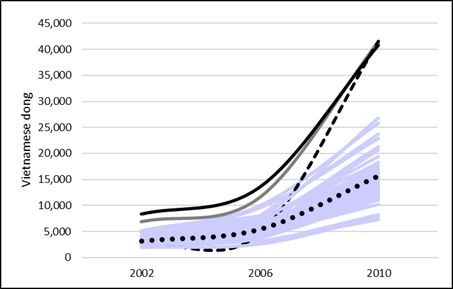
Note: The black line represents Ho Chi Minh City, the gray line Ha Noi, the dashed line Ha Tay, and the large dotted line Viet Nam. The light blue lines represent the rest of the provinces.
Source: Authors’ calculations based on Vietnam Household Living Standards Survey 2002, 2006, and 2010.
We perform recentered influence function (RIF) regressions to connect unconditional marginal quantiles to observable covariates (including household, structural, and geographical factors). The influence function is a useful tool for robustly estimating parameters for each quantile of interest (in our case for income quantiles). The RIF regressions indicate negative income gains associated with participation in both agriculture and manufacturing as opposed to participation in the service sector. However, skilled workers across all three sectors experienced positive income returns. In agriculture and manufacturing (and even services), the returns are only positive for the rich (Figure 3). In 2002, returns for participation in agriculture and manufacturing were negative across the income distribution. In 2010, however, returns to both the agriculture and manufacturing sectors improved for those in the top 20th percentile and top 10th percentile, respectively. These results reiterate the widening income disparity in Viet Nam, alongside economic growth and rising incomes.
Figure 3: Unconditional quantile regression coefficients
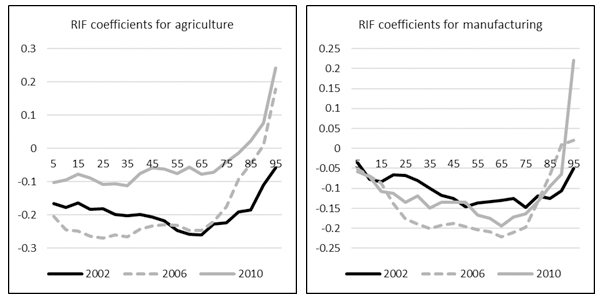
RIF = recentered influence function.
Note: The x-axis indicates the income quantiles.
Source: Authors’ calculations based on Vietnam Household Living Standards Survey 2002, 2006, and 2010.
In conclusion, growth in Viet Nam has not been inclusive. The data indicate that structural transformation occurred across all income quantiles, but the shift from agriculture to manufacturing was more prominent for those at the center of the income distribution. The data also indicate that returns to agriculture and manufacturing were only positive for the top 10th to 20th percentile, exacerbating the income divide. Growth incidence curves indicate that Viet Nam’s growth, especially from 2002 to 2010, has been pro-rich.
Moving forward, we propose three strategies to improve income equality in Viet Nam. First, improve skills acquisition for those in the lowest percentiles of the income distribution. There is strong evidence that skilled workers across the income distribution earn positive returns. Second, it is important to improve access to nonfarm activities for the poor. Given that sector productivity and incomes are higher in the modern sectors, the poor, who are unable to move to regions with higher modern sector concentrations, may be left out from reaping the growth dividends. Third, reduce ethnic disparities in income growth.
_____
*The GINI index is a measure of dispersion of income. It is the most commonly used measurement of income inequality. The index represents how a country’s income (or wealth) is distributed among its residents. A larger index value represents wider income inequality.
References:
World Bank. 2013. Vietnam Poverty Assessment: Well Begun, Not Yet Done – Vietnam’s Remarkable Progress on Poverty Reduction and the Emerging Challenges. Report. Washington, DC: World Bank.