
The study of the labor income share plays an important role in understanding the relationship between national income and personal income. However, most of the empirical studies on the labor income share are conducted at the country level, while the limited number of industry-level analyses focus primarily on advanced countries due to limited data availability.
In order to analyze the sector-level labor income share incorporating data from developing countries, we construct a new dataset at the 10-sector level.1 We collect information from three secondary data sources: the Groningen Growth Data Center 10-Sector Database, the Socio-Economic Account (SEA),2 and ILOSTAT.3 These datasets allow us to calculate the sectoral labor income shares for 53 countries across six regions.4 Of the countries, 20 are classified as developing countries.5 In this article, we would like to share the preliminary findings from the new dataset at the three-sector level to unveil the bigger picture.
In Figure 1, we show the unweighted regional averages of the labor income share in three broad categories.6 One must note that the numbers could be biased due to potential measurement error arising from sector-specific characteristics. For example, the labor income share could be overestimated for industries with many self-employed or seasonal workers, such as the agriculture and construction industries. This is because it is difficult to capture all the workers in such industries, and, as some studies suggest, in surveys, the self-employed tend to report incomes that are higher than their actual incomes.
Figure 1: Labor income shares across regions
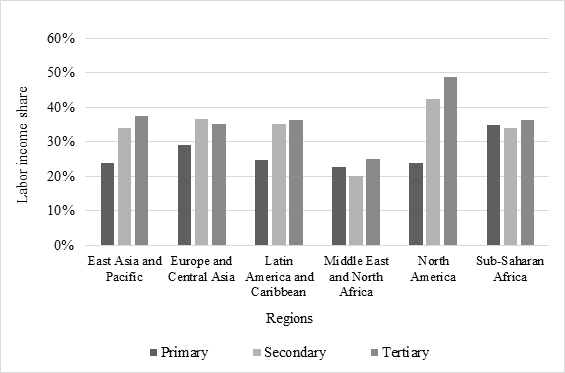
Source: Authors’ calculations.
With these caveats in mind, we find that the tertiary sector offers the most generous rewards to labor. One exception is for the Europe and Central Asia region, where the secondary sector’s ratio of labor income to sectoral value added is larger than the other two sectors. In contrast, labor in the primary sector receives the smallest share of income and is significantly lower compared to the other sectors in all regions but two. The two exceptions are the Middle East and North Africa region and the sub-Saharan Africa region. Interestingly, both regions have their smallest labor income shares in the secondary sector, and the differences between the three sectors are smaller than for the other regions.
To see the relationship between sectors, we plot the changes in the labor income share in the secondary sector against those in the tertiary sector. The left-hand panel of Figure 2 shows the scatter plot for 22 countries in the Europe and Central Asian region. A quick glance at the graph suggests a positive correlation between the changes in the two sectors.
Figure 2: Changes in labor income shares: Manufacturing versus services
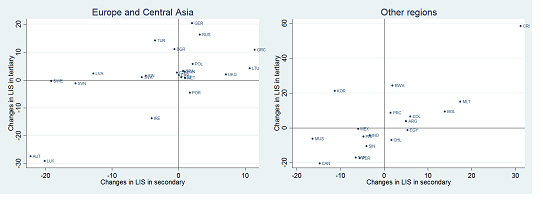
LIS = labor income share.
Note: The change in the labor income share is based on the starting and the ending year of the sample available for each country. For further details, see: Oishi and Paul (2018), Sectoral Labor Income Share Dynamics: Cross-Country Evidence from a Novel Data Set. ADBI Working Paper No. 875.
Source: Authors’ calculations.
During the sample periods, determined by the data availability for each country, the changes in the labor income share in the tertiary sector are the largest in Luxembourg (LUX) and Austria (AUT), and their changes are negative.7 Their changes in the secondary sector are also the largest and negative.8 About two-thirds of the countries in this region, 16 countries out of 22, experienced positive changes in their tertiary sector labor income shares. Among these, Germany (GER) experienced the largest changes.9 In the secondary sector, Greece (GRC) and Lithuania (LTU) experienced the largest positive changes.10 Compared with Germany and Lithuania, Greece shows a somewhat proportionate increase in both the tertiary and the secondary sectors.11 Portugal (POR) is the only country that appears in the fourth quadrant, showing a positive change in the secondary sector but a negative change in the tertiary sector. Including Portugal, only seven countries have opposite changes in their secondary and tertiary sectors.
The right-hand panel of Figure 2 shows the scatter plot for countries from other regions, mostly classified as developing countries. Overall, similar to the previous plot, we find a positive correlation. However, unlike the previous plot, more than half of the countries experienced a decrease in their tertiary sector labor income shares. In addition, we observe that regardless of the direction of the change, the percentage point changes in the tertiary sector are much larger than those in the secondary sector. We have 18 countries in this plot, and 15 countries are either in the first or third quadrants, which means that both the secondary and tertiary sector labor income shares moved in the same direction. Costa Rica (CRI) increased its labor income shares in both the secondary and tertiary sectors by the most among all countries,12 although there are countries with a longer sample period than Costa Rica. Another country worth noting is the Republic of Korea. Among the three countries with changes in opposite directions for their secondary and tertiary sectors, the Republic of Korea experienced significant changes in both sectors,13 while the other two countries’ changes were fairly close to zero.14
Many countries aim to improve people’s lives through increasing the labor income share and undertaking policy measures. However, as we have seen, some countries show opposite movements between the secondary and tertiary sectors. This suggests that the country-level evaluation of a policy may mask the dynamics. A policy may also lead to changes in opposite directions for the labor income shares of each sector. Therefore, if a government intends to target an increase in the labor income share to promote public welfare, sectoral analysis is indispensable.
There is no “ideal benchmark” or “specific target” for the labor income share. Interpretation of the labor income share requires careful attention and deeper understanding of each economy. And, of course, our calculation of the labor income share includes various noises and biases. However, we hope this sectoral analysis of the labor income share will contribute to evidence-based policymaking and lead to better policy outcomes.
_____
1 We follow the classification used in the Groningen Growth Data Center 10-Sector Database (https://www.rug.nl/ggdc/productivity/10-sector/).
2 The SEA is provided by the World Input Output Database (http://www.wiod.org/home).
3 ILOSTAT is provided by the International Labour Organization (ILO) (https://www.ilo.org/ilostat).
4 We follow the World Bank’s regional group classifications. We have 9 countries from East Asia and the Pacific, 27 from the Europe and Central Asia, 8 from Latin America and the Caribbean, 2 from the Middle East and North Africa, 2 from North America, and 5 from sub-Saharan Africa.
5 We follow the World Bank’s country classification by income level for 2018–2019.
6 Here, the primary sector includes the agriculture, hunting and forestry, fishing, and mining and quarrying sectors, following the International Standard Industrial Classification of All Economic Activities Rev. 3.1. The secondary sector covers the manufacturing and construction sectors. The tertiary sector consists of electricity, gas and water supply; wholesale and retail trade; repair of motor vehicles, motorcycles, and personal and household goods; hotels and restaurants; transport, storage, and communication; financial intermediation, renting, and business activities (excluding owner occupied rents); public administration and defense; education, health, and social work; other community, social, and personal service activities; and activities of private households.
7 Luxembourg -29.12 percentage points from 1995 to 2008 and Austria -27.46 percentage points from 1995 to 2007.
8 Luxembourg -20.13 percentage points and Austria -22.24 percentage points.
9 20.41 percentage points from 1996 to 2008.
10 Greece increases 11.47 percentage points 2000 to 2006 and Lithuania increases 10.72 percentage points from 1995 to 2008.
11 11.47 and 10.79 percentage points, respectively, during its sample period of 2000 to 2006.
12 58.41 percentage points in the tertiary sector and 31.23 percentage points in the secondary sector during 1998 to 2008.
13 While the tertiary sector increases by 21.15 percentage points, the secondary sector decreases by 11.29 percentage points during 1993 to 2008.
14 Egypt 5.34 percentage points and -1.40 percentage points for the second and tertiary sectors, respectively, from 1996 to 2007. Chile increases 1.69 and -0.72 percentage points for the second and tertiary sectors, respectively, from 2006 to 2011.