Introduction
In recent years, the sharp increase in oil prices that began in 2001 and the two sharp declines that followed in 2008, due to the subprime mortgage crisis, and at the end of 2014–early 2015 have renewed interest in the effects of oil prices on the macro economy. Most recently, the price of oil has more than halved in a period of less than 5 months since September 2014. After nearly 5 years of stability, the price of a barrel of Brent crude oil in Europe fell from over $100 per barrel in September 2014, to below $46 per barrel in January 2015.
This raises important questions to be answered. Firstly, are economies still elastic to oil price movements, or have new, energy-related technologies and resources, like renewables and shale gas, completely sheltered them from shocks? Secondly, if economies are still elastic, are emerging and developed economies influenced to the same degree?
We answered these questions in a recent study (Taghizadeh-Hesary et al. 2015). In the study, we analyzed the impact of oil price fluctuations on the gross domestic product (GDP) growth rate and consumer price index (CPI) inflation in the three largest crude oil consumers: the developed economies of the United States (US) and Japan, and an emerging economy, the PRC. For the analysis, we selected a period that includes the most recent financial crisis, the subprime mortgage crisis of 2008. This allowed us to compare the impacts in the period January 2000–July 2008 with the period following the crisis, August 2008–December 2013.
Overview of oil and energy in the People’s Republic of China, Japan, and the United States
People’s Republic of China
The PRC has quickly risen to the top ranks of global energy demand over the past few years. It is now the world’s second-largest oil consumer behind the US and has been the largest global energy consumer since 2010. The country was a net oil exporter until the early 1990s, and became the world’s second-largest net importer of crude oil and petroleum products in 2009. The PRC’s oil consumption growth accounted for one-third of the world’s oil consumption growth in 2013 and 43% of the world’s oil consumption growth in 2014. Despite the PRC’s slower oil consumption growth in the past few years, the United States Energy Information Administration (EIA) projects the PRC will account for more than a quarter of global oil consumption growth in 2015.
Japan
Japan is one of the world largest energy consumers. It is the world’s largest liquefied natural gas (LNG) importer, the second-largest coal importer, and third-largest net oil importer. Domestic energy sources in Japan meet less than 15% of its own total primary energy use.
Figure 1 shows the share of global oil consumption of the world’s three major oil consumers: the US, Japan, and the PRC. As the figure clearly shows, the US and Japan’s shares are decreasing, while the shares of the PRC and the rest of the world are on the rise.
Figure 1: Share of three major oil consumers in global oil consumption, 1960–2013
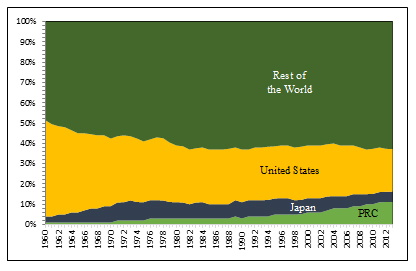
PRC = People’s Republic of China.
Source: Annual statistical bulletin of the Organization of the Petroleum Exporting Countries (OPEC) (2014).
In March 2011, a 9.0 magnitude earthquake struck off the coast of Sendai, Japan, triggering a large tsunami. The damage to Japan resulted in an immediate shutdown of about 10 gigawatts of nuclear electric generating capacity. Following the 2011 Fukushima disaster until May 2012, Japan lost all of its nuclear capacity as a result of scheduled maintenance and the lack of government approval to return to operation. Japan replaced the significant loss of nuclear power with imported natural gas, low-sulfur crude oil, fuel oil, and coal, spending $250 billion on total fuel imports in 2012, equating to a third of the country’s total imports. However, more recently, in April 2015 the Japanese government started discussing a draft electricity generation plan that includes nuclear energy as a base load source that by 2030 would provide up to 22% of the country’s electricity supply.1
United States
In 2014, the US consumed over 98 quadrillion British thermal units (BTU) of primary energy, making it the world’s second-largest energy consumer after the PRC.
According to the latest available data, oil meets 35% of US energy demand, with 70% directed to fuels used for transportation—gasoline, diesel, and jet fuel. Another 25% is used in industry and manufacturing, 4% is used in the commercial and residential sectors, and less than 1% is used to generate electricity. Oil is the main mover of US national commerce and its use for transportation has increased connectivity. Almost all US transportation is dependent upon fuel in concentrated liquid form, with major sources of imported oil from Canada, Mexico, and OPEC, particularly Saudi Arabia, including 20% from the Persian Gulf. The EIA estimates that in 2014, proven US reserves of crude oil and lease condensate exceeded 36 billion barrels. (EIA 2014).
What are the impacts of oil price fluctuations on emerging and developed economies?
Empirical results show that the impacts of oil price fluctuations on GDP growth rates for developed oil importers (US and Japan) are much milder than for emerging economies (PRC) (Taghizadeh-Hesary et al. 2015). The reasons for the difference between the impacts on these two groups are high fuel substitution (higher use of nuclear electric power, gas, and renewables), a declining population (in the case of Japan), the shale gas revolution (for the US), greater strategic crude oil stocks, and government-mandated energy efficiency targets in developed economies compared to emerging economies, which make them more resistant to oil shocks. In comparison, the impact of higher crude oil prices on PRC CPI inflation is milder than in the two advanced economies. The reason for this is that the higher economic growth rate in the PRC results in a larger forward shift of aggregate supply, which prevents large increases in price levels after oil price shocks.
By comparing the results of these two subperiods—(i) January 2000–July 2008 and (ii) August 2008–December 2013—we can conclude that in the second subperiod, the impact of oil price fluctuations on the US GDP growth rate and inflation rate was milder than in the first subperiod because of the lower crude oil and aggregate demand resulting from the recession in the economy. For Japan, the second subperiod coincides with the Fukushima nuclear disaster that followed the massive earthquake and tsunami in March 2011, which raised the dependency on oil imports. Hence, the elasticity of GDP growth to oil price fluctuations rose drastically. CPI elasticity declined, however, because of diminished consumption due to uncertainty in the nation’s future after the disaster. The PRC’s GDP growth and inflation rate elasticities to oil price fluctuations were almost constant in both subperiods. The main reason for this is the appreciation of the yuan. Shortly after the subprime mortgage crisis, oil prices started to increase sharply due to a mild recovery in the global economy and the huge quantitative easing policies of the US and monetary authorities in other countries. Simultaneously, the yuan appreciated compared to other currencies, meaning that the price of crude oil in the PRC’s domestic market did not fluctuate as much. The result was that crude oil prices had almost no impact on the PRC’s economy (GDP and inflation) before and after the crisis.
_____
1 http://www.nei.org/News-Media/News/Japan-Nuclear-Update
References:
Organization of the Petroleum Exporting Countries (OPEC). 2014. Annual Statistical Bulletin of the Organization of the Petroleum Exporting Countries. Vienna: OPEC.
Taghizadeh-Hesary, F., N. Yoshino, M. M. H. Abadi, and R. Farboudmanesh. 2015. The Response of Macro Variables of Emerging and Developed Oil Importers to Oil Price Movements. Journal of the Asia Pacific Economy.
United States Energy Information Administration (EIA). 2014. Annual Energy Outlook 2014: With Projections to 2040. Washington, DC: EIA.
Photo: By Trevor MacInnis (Trevor MacInnis) [CC BY-SA 2.5 [1]], via Wikimedia Commons [2]