Introduction
Chile, Mexico, and Peru are the three Latin American countries participating in the negotiations of the Trans-Pacific Partnership Agreement (TPP). Although these countries have cultural and geographical proximity, they exhibit different export structures and consequently different objectives toward the ongoing TPP negotiations. Even more intriguing is to understand the particular interests of each country in light of the key issues being negotiated and discussed, such as agriculture, intellectual property rights, and trade in services.
Latin American trade in goods patterns
The Latin American participants in the negotiations have an export structure heavily biased toward commodity exports. Chile and Peru’s goods export structures follow a similar pattern. Both countries rely heavily on primary goods and natural resource-based manufactures as their main sources of export income. Minerals and metals account for 63.3% of Chile’s total exports, mostly in the form of copper and copper-derived products. Peru’s total exports of minerals and metals represent a similar share of 60.6%, though mineral supply is more diverse than Chile, with a greater variety of metals such as gold, copper, lead, zinc, and iron.
Due to this strong dependency on mineral products, both Chile and Peru have followed production diversification strategies over the last 3 decades. Both countries have been reducing their share of commodities and in favor of higher value-added goods, particularly within the agriculture sector. The countries have been successful at increasing the production of fresh fruit and vegetable, as well as foodstuffs and edible preparations. Although the level of technology used in production processes still lags behind other sectors, such as textiles and automobiles, labor intensity and intersectoral connectivity is higher than in mining and other extractive industries.
Mexico follows a different pattern. Although 13.7% of the country’s exports are hydrocarbons and 9.8% are minerals and metals, it has a more diversified export structure. As can be seen in Table 1, Mexico’s exports to the rest of the world are mostly concentrated in medium- and high-technology manufactures, such as transport vehicles and electronics. These types of products, which are usually sensitive to technology shocks and supply chain disruptions, account for 51% of Mexico’s global exports. Although nearly 78% of its exports go to Canada and the United States, 6.4% go to Latin America. Mexico’s trade pattern and network of agreements allow it to exploit its role as a gateway to markets in North America and Latin America.
Table 1: Export Structure of Goods to the World for Chile, Mexico, and Peru in 2013 by Technology Level
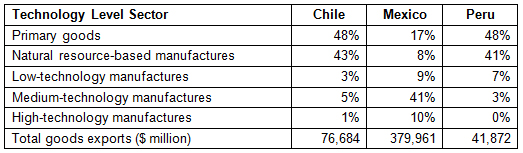
Sources: Sectors are classified by levels of technological sophistication, as specified by Lall (2000); authors’ calculations based on UN Comtrade (accessed March 2015).
Latin American trade in services patterns
For the export of services, Latin American countries participating in the TPP display a dynamic, but incipient, development. Trade in services in Chile, Mexico, and Peru grew by 112%, 43%, and 206%, respectively, in the last decade. However, the services export share of total exports in 2013 accounted for only 14%, 5%, and 13% in the same countries.
As shown in Table 2, global services exports from these Latin American countries follow different patterns. For instance, the most important service sector for Chile is transport, and the country has world class enterprises competing in the maritime and airline industries with strong participation in regional transport markets. This has meant, despite the physical distances that separate Chile from major world markets, an increase in connectivity and, therefore, facilitation of the export of other services that strategically depend on the international movement of people. In this regard, it is important to note that the service sectors that grew the most during 2008–2012 were financial services (824%), computer and information services (114%), and other business services (39%).
In the case of Mexico and Peru, the most important sector in terms of trade value has been the travel sector. Although export volumes for Peru are substantially lower than for Chile and Mexico, the country has shown more dynamic development in various service sectors. The most dynamic sectors in Peru between 2008 and 2012 were royalties and license fees (668%), personal, cultural, and recreational services (157%), and computer and information services (132%), with overall growth of services exports to the world of 41%. Mexico, in contrast, experienced a decline in the growth of services exports of 8% over the same period, with stagnant growth within service sectors.
Table 2: Export Structure of Services to the World for Chile, Mexico, and Peru in 2013 by Service Sector
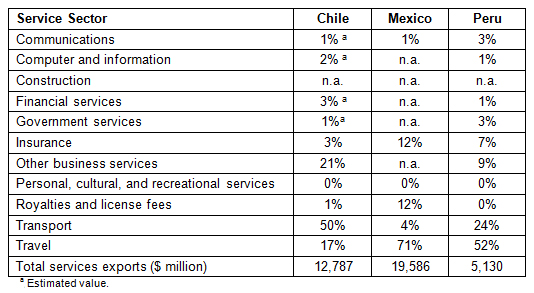
Note: For Peru, data is from 2012 due to the non-availability of services data per sector for 2013. Overall exports of services from Peru to the world were valued at $6,102 million in 2013.
Source: UNCTAD Data on Trade in Services (accessed March 2015).
Final remarks
The national trade incentives of the Latin American countries negotiating in the TPP are different, but share some common points. For instance, for Chile, there is a clear connection between the development of fresh food and edible preparations and the advancement of exports of transport services, as a large part of the competitiveness of these products relies on efficient and accurate delivery times. Therefore, we might see particular interest in the transport service sector, especially as long as the negotiated rules favor Chilean transport competitiveness, as well as strategic services such as financial services. For Peru, it is a process of harmonizing regulatory framework, predominantly sanitary and phytosanitary measures that can ease or restrict market access to the agricultural products the country is trying to promote. Moreover, once the agreement is signed and enters into force, Peru will have five new trade partners in Southeast Asia and Oceania under a FTA-type agreement, and therefore will be more connected to consumption and investment patterns in Asia and the Pacific. Finally, Mexico will benefit, along with Peru, from sealing commitments with Asia and the Pacific trade and investment partners. This will fit perfectly in its strategy to consolidate itself as a gateway for products to the North American and Latin American markets .
_____
1 See Gallagher et al. (2013).
2 As of March 2015, Peru already has FTAs with Canada, Chile, Japan, Mexico, Singapore, and the United States. Once the TPP has been signed, Peru will have new generation trade and investment agreement with Australia, Brunei Darussalam, Malaysia, New Zealand, and Viet Nam. For further detail of Peru’s FTAs, see Gonzalez Vigil and Shimizu (2012).
3 See Dussel (2013).
References:
Dussel, E. 2013. Mexico and the Asian Challenge, 2000-2012. In Reaching Across the Pacific: Latin America and Asia in the New Century, edited by C. J. Arnson and J. Heine. Washington, DC: Woodrow Wilson International Center for Scholars.
Gallagher, K., R. Ffrench-Davis, M. Lim, and K. Soverel. 2013. Financial Stability and the Trans-Pacific Partnership: Lessons from Chile and Malaysia. GEGI Working Paper [1].
Gonzalez-Vigil, F, and T. Shimizu. 2012. The Japan-Peru FTA: Antecedents, Significance, and Main Features. IDE Discussion Paper 335 [2]. Chiba, Japan: Institute of Developing Economies Japan External Trade Organization.
Lall, S. 2000. The Technological Structure and Performance of Developing Country Manufactured Exports, 1995–1998. Oxford Development Studies 28(3): 337–369.
Photo: By Kabelleger / David Gubler (http://www.bahnbilder.ch) (Own work: http://www.bahnbilder.ch/picture/10176) (“Prat – Cumbre pass [3]“). Licensed under CC BY-SA 3.0 [4] via Wikimedia Commons from Wikimedia Commons.