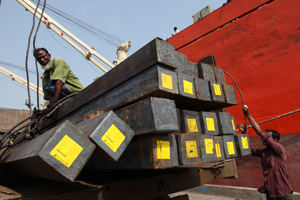
South Asian and Southeast Asian economies have all embraced an outward-oriented development strategy, albeit to different degrees. The result has been an impressive increase in international trade, foreign direct investment (FDI) inflows, and significant productivity improvements, which in turn have contributed to important socio-economic gains. Indeed, some of these economies have delivered among the most striking economic performances in the world.
Nevertheless, economic integration across these two large subregions is still very low, even if the value of cross-subregional trade has been growing over time. A forthcoming (2015) ADB/ADBI study considers what the bottlenecks to economic integration have been, including those related to transport infrastructure, policy-related barriers, trade-facilitation issues, and institutional constraints, and how the two subregions might address them. Below we estimate the potential benefits (and costs) of closer integration using a Computable General Equilibrium (CGE) model under several policy scenarios.
We find the potential gains of closer cooperation to be large, assuming that appropriate “soft” (e.g., trade facilitation) and “hard” infrastructure are put in place to reduce cross-subregional trade costs, which at present are high. With Myanmar adopting sweeping reforms beginning in 2011, the prospects for improving connectivity across the two subregions are better than ever.
Model of Integration and Scenarios
The model employed uses recent innovations in trade theory that incorporate heterogeneous firms into the CGE framework. The firms of most sectors in the model are heterogeneous in productivity, enabling the model to reflect intra-industry changes that occur when, for example, trade liberalization enables the most productive firms to export more and expand output, and the least productive ones to contract in the face of stiffer import competition (thereby increasing efficiency and productivity). Given the additional costs incurred in export activity, including both fixed and variable costs, the model is also able to capture both the intensive margins (more trade of already-traded products) and extensive margins (trade in products not traded previously).
We used several scenarios to capture the effects of South Asia–Southeast Asian economic integration on economic welfare, trade, factor returns, and structural change for the subregional economies, each corresponding to differing levels of integration ambition. The policy innovations include full liberalization of tariff barriers, reduction of non-tariff barriers (NTBs) by 50 percent (under the assumption that not all NTBs can be addressed by policy), and improvements in (soft and hard) “connectivity” manifested in varying decreases in trade costs. We assume two possibilities of trade-cost reduction, i.e., 5 percent and 15 percent, to provide a range of efficiency gains due to better connectivity. Given relatively high cross-subregional trade costs and ample room to reduce them via trade facilitation and investment in hard infrastructure, this range was deemed to be plausible.
Liberalization of these barriers to trade is assumed to take place over the period 2016–2025 and is compared relative to the baseline forecasts, with projections ending in 2030. The simulations allow for the following country breakdowns within the two subregions: (1) South Asia: Bangladesh, India, Nepal, Pakistan, Sri Lanka, and “Other South Asia”; and (2) Southeast Asia: Cambodia, Indonesia, Lao PDR, Malaysia, the Philippines, Singapore, Thailand, Viet Nam, and “Other ASEAN,” which is mainly composed of Myanmar but also includes Brunei Darussalam and Timor-Leste. In addition, the model includes 21 sectors (7 in primary products/agriculture, 9 manufacturing sectors, and 5 service sectors).
The scenarios analyzed below are:
1. SAFTA1: Removal of all tariffs across South Asian economies over period 2016–2025;
2. SAFTA2: SAFTA1, plus 50 percent reduction in NTBs and 15 percent reduction in trade costs;
3. SA/SEA1: Removal of all tariffs across South Asian and Southeast Asian economies; and
4. SA/SEA2: SA/SEA1, plus 50 percent reduction in NTBs between South Asia and Southeast Asia and a 15 percent reduction in trade costs associated with South Asian and Southeast Asian trade.
Trade integration is considered separately for South Asia first, since Southeast Asian cooperation is already deep—with the ASEAN Free Trade Area (AFTA) in place and an ASEAN Economic Community (AEC) on the way. The third and fourth scenarios then show the overall benefits of cross-subregional integration for both subregions.
Results
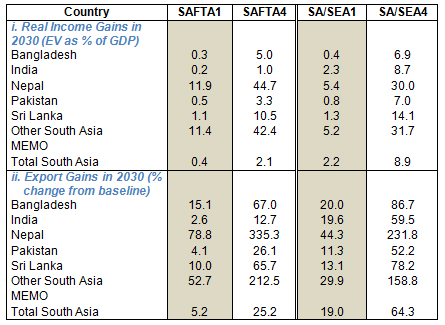
The results from the simulations are included in the table below. Net gains accrue in all scenarios and for all economies, though the distribution of the aggregate net benefits varies considerably. For example, under scenario SA/SEA2, welfare in South Asia and Southeast Asia would rise by $375 billion (8.9 percent of GDP) and $193 billion (6.4 percent of GDP), respectively, by 2030, relative to the baseline. In South Asia, the smaller countries show the greatest percentage gains under this scenario, especially Nepal and Sri Lanka. In Southeast Asia, the greatest percentage gains are seen in Singapore, Malaysia and Viet Nam, while the Lao PDR loses slightly. These gains will be driven by rising exports and competitiveness, particularly for South Asia, whose exports almost rise by two-thirds. Hence, we conclude that investments in cross-subregional connectivity would justify a high level of investment.
Table 1: Effects on income and exports of deeper South Asia-Southeast Asian cooperation
A. South Asia
B. Southeast Asia

Source: Wignaraja et al. 2014.
The model results show that South Asian economies often experience large changes in industrial structure as they specialize further in sectors where they have a comparative advantage. Sometimes these estimated changes look exaggerated, as a small change from a very small base will yield a large result. For example, in Nepal, the chemical sector in both SAFTA2 and SA/SEA2 increases by more than 10 fold, but it is a small sector (5 percent of the manufacturing sector and only 0.67% of labor compensation in manufacturing). The Food and Other Grains sectors in India experience a strong negative shock, whereas metals and chemicals experience significant gains. Indeed, structural change in India and Pakistan present essentially mirror results; the Indian manufacturing and services sectors tend to expand and agriculture contracts, whereas the exact opposite happens in the case of Pakistan. An important point to underscore, however, is that since this is a long-run model, the employment closure in the model assumes full employment, meaning that for a comparative advantage sector to expand, resources have to be moved from another sector. Movement across sectors in favor of greater efficiency is what ultimately leads to the large economic gains reaped by South Asian economies.
There will be significant structural adjustment in the ASEAN economies as well, but again one must be careful in drawing conclusions regarding the significance of the magnitudes of the effects. For example, Singapore experiences a contraction of one-third in its “Other Gains” sector. However, this sector is extremely small; the percentage change may be large, but the significance for labor adjustment in Singapore is trivial. Still some general observations are in order. First, more agricultural sectors will contract than expand in most ASEAN economies, with the notable exceptions of Indonesia and Thailand. Manufacturing sectors tend to expand in the majority of countries, again with the exception of Indonesia (whose manufacturing sectors contract) and varied results in the cases of the Lao PDR and Myanmar/other ASEAN. The effects on service sectors are even more mixed, with Singapore and Malaysia mostly winning but with varied results in other economies.
Conclusions
In sum, the gains from cross-subregional economic integration are in fact large for essentially all countries. In general, the deeper the integration scenarios, the greater the gains. Reducing trade costs in the subregions generates the most important gains, but so does removing NTBs and tariffs (in the context of South Asia in particular). On the whole, South Asia does much better in the context of a cross-subregional FTA than with merely an intra-subregional FTA. Still, the results support a two-track approach to economic cooperation on the part of South Asian countries; that is, strengthening intra-subregional integration across South Asian partners at the same time that it pursues deeper forms of economic cooperation with Southeast Asia. Moreover, by deepening links with South Asia, Southeast Asia is able to benefit from greater market access and cost reductions in the relatively protected South Asian subregion, leading to greater gains (6.4 percent rise in real income relative to GDP) than even in the case of the AEC, where Petri et al. (2012), for example, estimates a subregional gain of about 5 percent. Exports tend to be an important driver of gains in all scenarios but particularly in the context of a South Asian-Southeast Asian FTA for the larger South Asian economies. Additionally, a South Asia-Southeast Asia FTA would increase significantly the internationalization of especially the South Asian economies. Indeed, the internationalization of the Nepalese economy rises by almost one-third, and of the “Other South Asian economies” by more than one-fourth.
In short, the estimates generated by the CGE model make a strong case for deeper intra- and cross-subregional economic cooperation as well as initiatives that lower the cost of doing business and trade, especially in South Asia, via investments in greater connectively through improved hard and soft infrastructure. ADB/ADBI (forthcoming 2015) suggests how this might be done in terms of improving trade-facilitation-related variables, investments in transport infrastructure and energy, improved financial infrastructure to facilitate investment and provide trade finance, and concomitant cooperation and development of regional institutions.
To be sure, dramatic increases in efficiency always derive from structural change. These changes could alter the distribution of income in ways that could exacerbate existing problems, such as the trend toward rising income inequality in many Asian economies since the global financial crisis. This does not suggest that these initiatives should not be embraced; it only underscores the importance of active government policies to facilitate economic integration and ensure that the big “winners” of integration will compensate the most vulnerable that lose from it.
_____
References:
ADB/ADBI, forthcoming 2015. Connecting South Asia and Southeast Asia. Tokyo: ADB Institute.
Petri, Peter A, Michael G. Plummer, and Fan Zhai, 2012. The Economic Impact of the ASEAN Economic Community: An Applied General Equilibrium Approach. Asian Economic Journal 26(2): 93–118.
Wignaraja, Ganeshan, Peter Morgan, Michael G. Plummer, and Fan Zhai, 2014. Economic Implications of Deeper South Asian-Southeast Asian Integration: A CGE Approach, ADBI Working Paper No. 494 [1].